- Application observability and network observability: same word, different discipline
- The SRE-to-NOC handoff is where incident hours disappear
- Layers 1 through 3 need purpose-built tooling, not adapted dashboards
Back
Why Network Observability Is Not Application Observability (and Why That Distinction Costs You Hours)
Prashanth VijayMAY 14, 2026
Industry
Internet Service Providers (ISP)
Network Scale
Why Network Observability Is Not Application Observability (and Why That Distinction Costs You Hours)
When your application slows down, you open Datadog, New Relic, or Grafana. You trace the request, find the bottleneck and fix the code.
When your network slows down, you open those same tools and a dozen other vendor portals. You trace the request and you hit a wall.
The wall is not a bug, it’s a category mismatch. Most observability platforms were designed to answer application-layer questions:
- Is the service healthy?
- Are response times within SLOs?
- Did the last deploy introduce a regression?
- They answer those questions extremely well
A decade of investment has made application-layer observability one of the most mature categories in infrastructure software
But network operators live in a different world. Their questions sound different:
- Is the link actually up?
- Is this fiber span degraded?
- Did BGP converge correctly after that maintenance window?
- Is congestion reshaping traffic in ways that no dashboard is showing?
These are not edge cases. They are the daily reality of anyone who operates physical infrastructure at scale. ISPs, telecoms, data center operators, MSPs. And the tools that dominate the observability market were never built to answer their questions.
Two Problems That Look the Same (Until They Don’t)
Application observability and network observability share surface-level similarities. Both involve metrics, logs, and alerts. Both care about latency, throughput, availability, and exist to reduce downtime.
The overlap ends there.
Application observability is built around request-level tracing. A user clicks a button, a request travels through microservices, and the platform reconstructs that journey. The data is structured, the sources are instrumented, and the failure modes are well-understood. When something breaks, the trace usually tells you where.
Network observability deals with a fundamentally different substrate. Traffic does not follow neat request paths. It traverses physical links, passes through vendor-diverse hardware, gets shaped by routing protocols that make autonomous decisions, and interacts with environmental factors (fiber cuts, weather, RF interference, construction crews) that no application ever has to think about.
The data sources are different, too. Instead of structured traces, you get SNMP polls, streaming telemetry via gRPC/gNMI, syslog messages, carrier maintenance notices, and customer trouble tickets. Much of this data is unstructured or semi-structured. Some of it is unreliable. And correlating it requires understanding network topology in a way that most observability platforms simply do not support, because they were never designed to model it.
The practical cost of this mismatch shows up in three places:
- Alert correlation breaks down at the network layer
- Incident investigations fragment across teams
- Critical operational context lives outside the observability stack
Alert correlation breaks down at the network layer
Application monitoring platforms correlate alerts based on service dependencies. Service A calls Service B, so a failure in B explains errors in A. This works because the dependency graph is known and relatively stable.
Network alert correlation is a different problem entirely. A single fiber cut can cascade across dozens of circuits, generating hundreds of alerts from devices that have no direct dependency relationship in any service map. To correlate those alerts, you need to reason about physical topology, route convergence, and failover behavior. You need to know that three seemingly unrelated alarms on three different routers all trace back to one shared fiber span. Application observability tools do not model any of this. They were not designed to.
Incident investigations fragment across teams
When an SRE sees elevated latency, the investigation typically follows the software path: check the load balancer, check the database, check the message queue, check the CDN. If none of those explain the problem, the conclusion is often "it might be the network" followed by an escalation to the NOC.
That escalation is where hours disappear. The NOC engineer now starts from scratch with their own toolset, manually correlating the time window against interface counters, BGP tables, optical power levels, and maintenance calendars. The two teams are looking at the same incident through completely different lenses, with no shared context and no shared language.
This is not a people problem. It is a tooling problem. The observability platform that the SRE relies on was never designed to surface network-layer root causes. And the tools the NOC uses were never designed to share context upstream.
Critical Operational Context Lives Outside the Observability Stack
Application observability platforms store context in structured formats: traces, spans, error logs, deployment events. Network incident context lives in carrier email threads, NOC Slack / Teams channels, tribal knowledge, and the memory of whoever was on-call last time this circuit acted up.
When a network incident occurs, the most critical information for resolving it often exists outside any monitoring system. It lives in a maintenance notice that arrived three days ago, in a postmortem from six months back, or in the head of a senior engineer who has seen this exact failure pattern before and remembers which vendor TAC contact to call. No amount of dashboard improvement solves this problem, because the problem is not visualization. It is context.
The internet operates across seven layers (the OSI model), but most observability investments concentrate on Layers 4 through 7: TCP sessions, HTTP requests, application logic, and user-facing performance. This makes sense for software companies. It does not make sense for anyone who owns or operates the physical transport underneath.
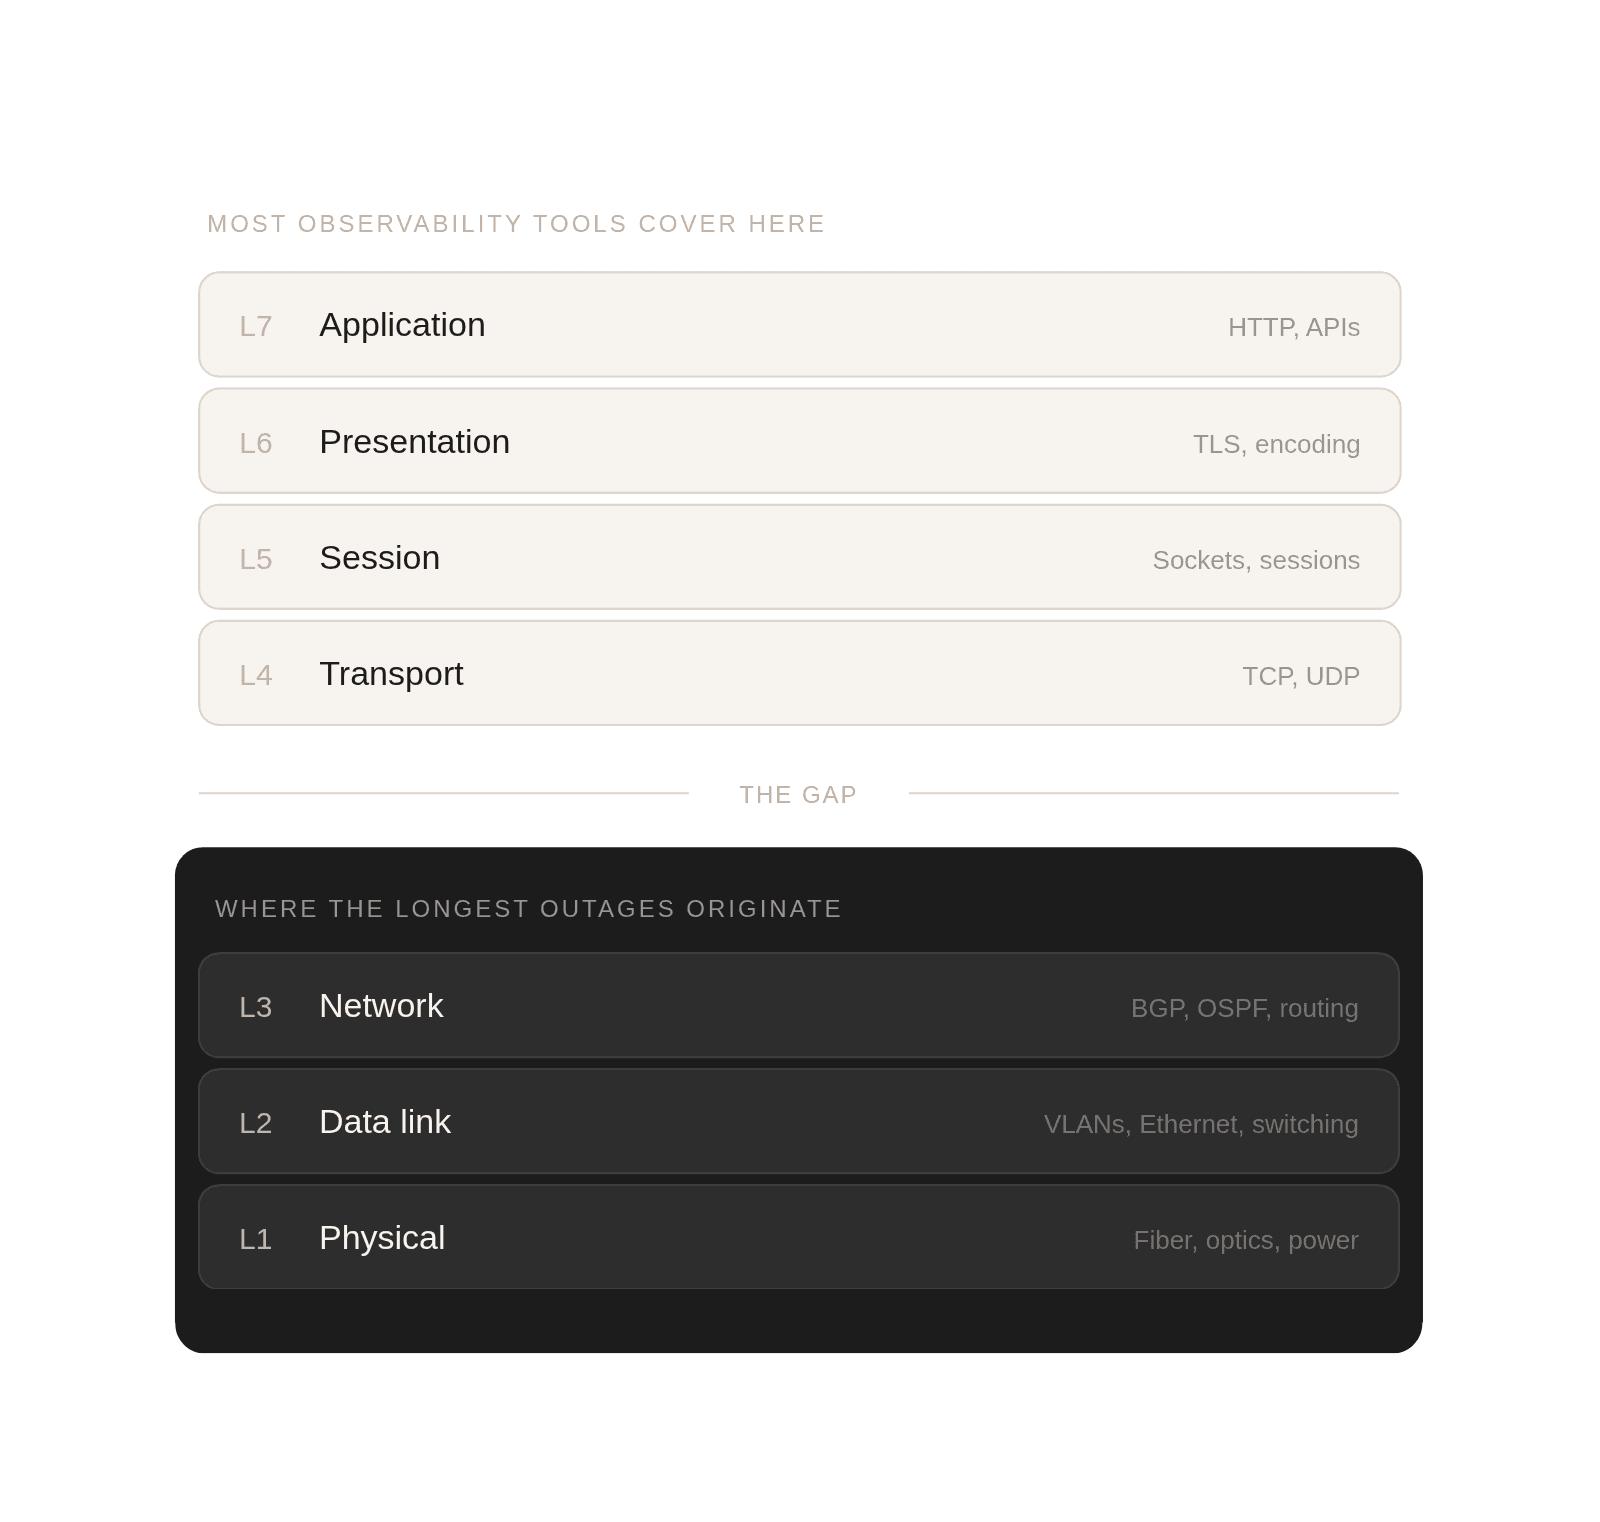
Layers 1 through 3 (the physical link, the data frame, and the network route) are where the longest and most expensive outages originate. Fiber degradation. Optical signal loss. BGP misconfigurations. Congestion on a shared trunk that no application-layer metric will ever explain. A misconfigured VLAN that silently drops 5% of packets for a subset of customers.
When observability only covers the top of the stack, the bottom becomes a black box. Engineers know something is wrong, but the tools they rely on cannot tell them what, where, or why. The result is a familiar pattern: the SRE team spends 30 minutes confirming the problem is not in their domain, then hands it to the NOC, who spends another hour reconstructing context that should have been available from the start.
The distinction between application observability and network observability is not academic. It directly determines how long your incidents last and how many people you burn through resolving them.
Building real observability for Layers 1 through 3 requires a fundamentally different approach than what the application-centric platforms have built.
It means understanding topology, not just metrics. A latency spike on a link means nothing without knowing what that link connects to, what traffic it carries, what alternative paths exist, and whether a failover has already occurred.
It means ingesting unstructured signals. Carrier notices, customer tickets, and NOC notes are not noise. They are operational context that should inform every alert and every triage decision.
It means reasoning across time. Network failures are often intermittent. A 2% packet loss that appears for 20 minutes every morning looks like nothing in a daily average. In real time, it is destroying VoIP quality for an entire region. Catching it requires pattern memory, not just threshold alerting.
It means correlating physical and logical events. A maintenance window on a fiber span should automatically suppress alerts on the circuits it carries. Today, that correlation is almost always done manually, if it happens at all.
And it means translating network truth into language that SRE teams can act on. The NOC should not need to spend 30 minutes writing a Slack message to explain what a BGP route leak means for the application team. The tooling should bridge that gap automatically.
The observability market has spent a decade building excellent tools for software teams. That investment has paid off: application-layer reliability has improved dramatically. Incident response for code-level failures is faster and more structured than ever.
But the network layer has been left behind. Not because it is less important, but because the problem is harder. Physical infrastructure is messy, vendor-diverse, partially observable, and influenced by forces that no software model accounts for. The tools that work beautifully for microservices do not translate to fiber spans and BGP tables.
This is the problem we are focused on at Supertrace. Not adding another dashboard on top of existing telemetry, but building AI that reasons about network topology, correlates physical and logical signals, and helps NOC engineers resolve incidents faster with full context from the start. Trusted assistance that makes the network itself explainable.
Because when a fiber cut cascades at 3am, the last thing your team needs is a tool that tells them the application is slow. They already know that. What they need is a tool that tells them why.
Transform your network operations
Book a demo today